这里使用了二维矩阵线程插值的方法和通过操作像素颜色来对QImage进行快速渲染方法,在之前的博文中有详细介绍。
二维矩阵线性插值方法:http://cppdebug.com/archives/155
QImage快速渲染方法:http://cppdebug.com/archives/186
数据与颜色之间的转换
通常需要使用Contour图展示的数据,都是三维数据。在绘制的过程中,一般用横纵坐标轴表示其中的一个数据,然后另一个数据使用颜色表示。
对于这样的需求,使用之前写到过的image数据渲染方法,非常简单就可以实现。
稍微改一改之前的代码:
unsigned int getValue(float x, float y)
{
    float max = std::max(image->width(), image->height());
    float scale = 255 / max;
    return scale * std::abs(x - y);
}
void Widget::drawImage(){
    QImage image = new QImage(QSize(800, 400),QImage::Format_ARGB32);
    for (int h = 0; h < image->height(); h++)
    {
        unsigned char* line = image->scanLine(h);
        for (int w = 0; w < image->width(); w++)
        {
            unsigned char a = 0xff;
            unsigned char r = getValue(w, h);
            unsigned char g = 0x00;
            unsigned char b = 0x00;

            *line = b;
            line++;
            *line = g;
            line++;
            *line = r;
            line++;
            *line = a;
            line++;
        }
    }
}
只需要在getValue函数中实现从数据到颜色的转换,就可以实现第三维数据的展示了。
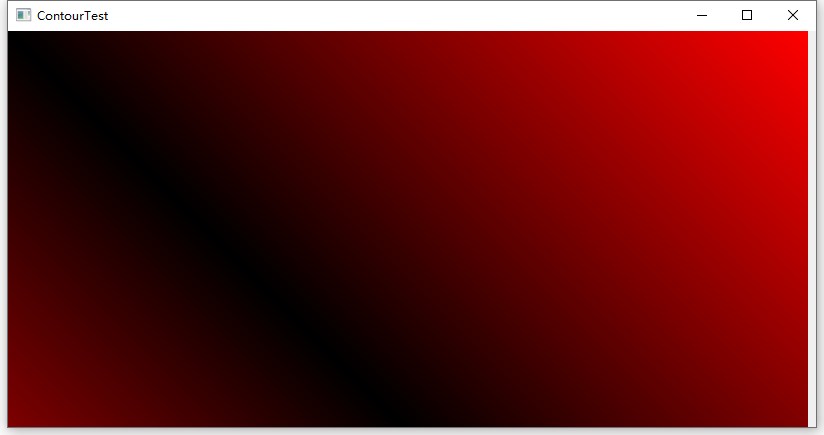
因为这里只影响了r的值,所以得到是一个红黑相间的渐变色。
当然,我们可以再写复杂一点,先写一个颜色数据到颜色的转换类。
class ColorMap {
public:
    ColorMap(const float& min, const float& max) {
        this->max = max;    //数据范围
        this->min = min;
    };
    QRgb getColor(const float& value) {
        //实现数据到颜色的转换方式,这里可以随意发挥
        if (value < min || value > max)
            return qRgb(0xff, 0xff, 0xff);
        unsigned char r(0xff), g(0xff), b(0xff);

        float length = max - min;
        float v = value - min;
        if (v > length * 0.7) {
            r = 255 /(0.3*length) * (v - length * 0.7);
        }
        else if (v > length * 0.3) {
            g = 255 / (0.4 * length) * (v - length * 0.3);
        }
        else {
            b = 255 / (0.3 * length) * v;
        }

        return qRgb(r, g, b);
    }
public:
    float max,min;
};
再对之前的渲染代码做亿点点修改。
//这个函数主要为了生成矩阵数据,返回值可以随意发挥
unsigned int Widget::getValue(float x, float y)
{
    return std::abs(x - y);
}
void Widget::drawImage(){
    QImage image = new QImage(QSize(800, 400),QImage::Format_ARGB32);
    ColorMap colorMap(0, std::max(image->width(), image->height()));
    for (int h = 0; h < image->height(); h++)
    {
        unsigned char* line = image->scanLine(h);
        for (int w = 0; w < image->width(); w++)
        {
            QRgb color = colorMap.getColor(getValue(w,h));
            unsigned char* c = (unsigned char*)(&color);

            unsigned char a = *(c + 3);
            unsigned char r = *(c + 2);
            unsigned char g = *(c + 1);
            unsigned char b = *c;

            *line = b;
            line++;
            *line = g;
            line++;
            *line = r;
            line++;
            *line = a;
            line++;
        }
    }
}
运行之后可以得到这样的结果:
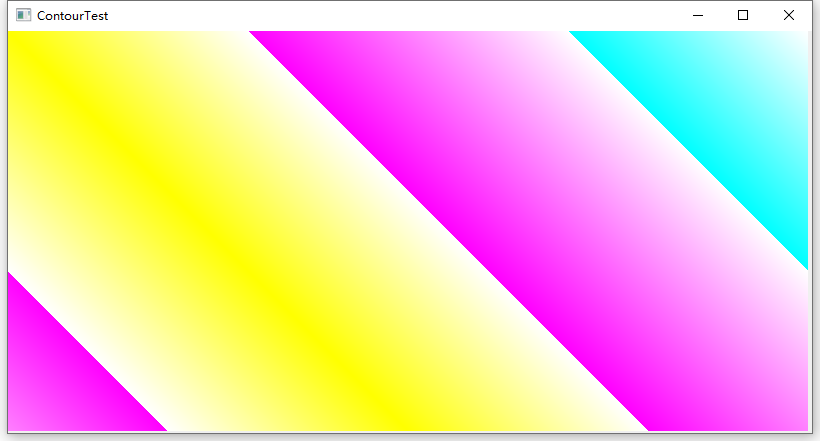
这里由于生成矩阵的规则过于简单,所以得到的图片也只能这样平平无奇了。
矩阵数据的着色
之前有记录过等值线的插值算法,可以将插值前后的数据可视化验证一下插值的效果怎么样。
首先是未经过插值的数据,这里主要修改getValue这个函数,然后为了对比插值之后的趋势变化,将颜色改为只有红色的变化。
代码如下:
class ColorMap {
public:
    ColorMap(const float& min, const float& max) {
        this->max = max;
        this->min = min;
    };
    QRgb getColor(const float& value) {
        unsigned char r(0xff), g(0x00), b(0x00),a(0x00);
        a = 255 / (max - min) * value;
        return qRgba(r, g, b,a);
    }
public:
    float max,min;
};

const int width = 4;
const int height = 4;
const int newWidth = 2 * width - 1;
const int newHeight = newWidth;
int array[width][height] = {
{1,5,4,10},
 {2,6,1,5},
{3,5,7,7},
{9,6,2,5} };

float Widget::getValue(float x, float y)
{
    int blockW, blockH;
    blockW = image->width() / ::width;
    blockH = image->height() / ::height;
    int indexw, indexh;
    indexh = y / blockH;
    indexw = x / blockW;


    return  ::array[indexw][indexh];
}
void Widget::drawImage()
{
    QImage image = new QImage(QSize(800, 800),QImage::Format_ARGB32);
    float width, heigt;
    width = image->width();
    heigt = image->height();
    ColorMap colorMap(0, 10);
    for (int h = 0; h < image->height(); h++)
    {
        unsigned char* line = image->scanLine(h);
        for (int w = 0; w < image->width(); w++)
        {
            QRgb color = colorMap.getColor(getValue(w,h));
            unsigned char* c = (unsigned char*)(&color);

            unsigned char a = *(c + 3);
            unsigned char r = *(c + 2);
            unsigned char g = *(c + 1);
            unsigned char b = *c;

            *line = b;
            line++;
            *line = g;
            line++;
            *line = r;
            line++;
            *line = a;
            line++;
        }
    }

}
运行之后可以得到这样的结果:
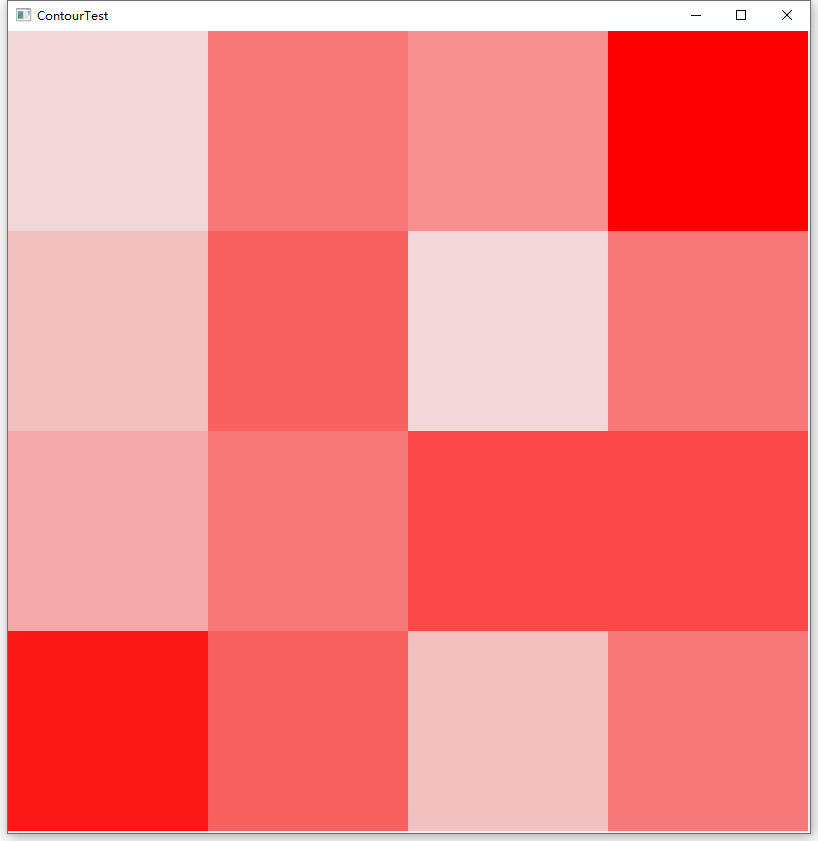
这是直接将矩阵按照实际大小着色的,所以看起来是满屏幕的小方块。
加入插值的代码,这个详细的代码参考之前的线性插值算法的代码,就不重复贴了。
插值之后可以得到这样的效果:
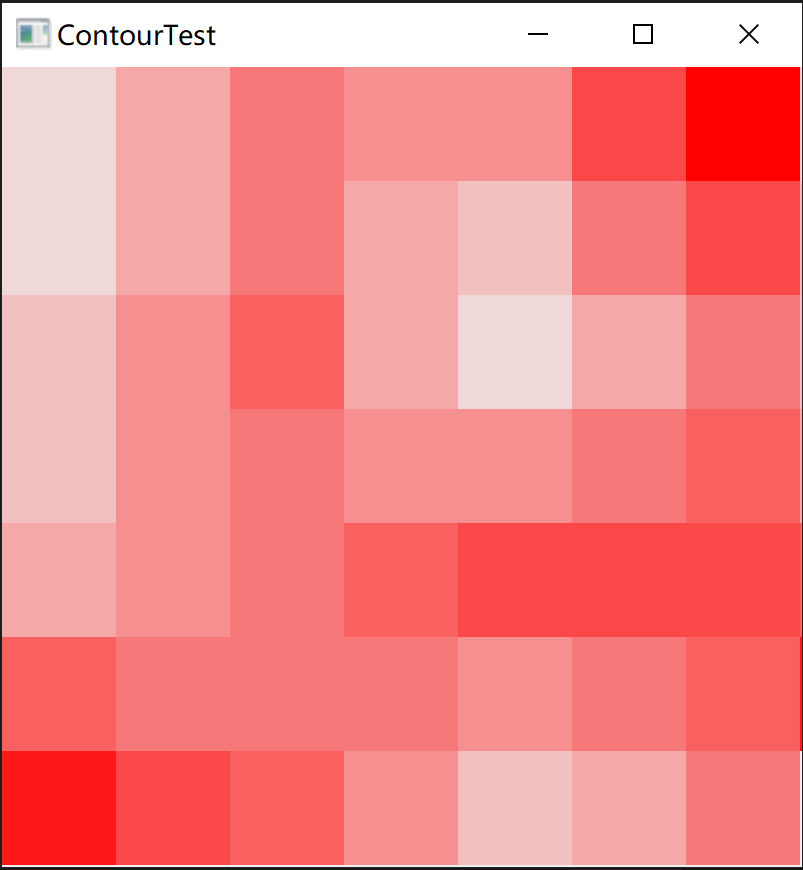
从总体的颜色深浅变化趋势上来说,和上以正图片还是比较一致的,这也验证了之前测试的线性插值算法确实可行。
一般来说contour图表都需要像素点级别的插值,才能将得到一张颜色过度较为平滑的图片,而不是像现在这种AV画质。
要实现像素点级别的插值,只需要对getValue函数进行亿点点修改:
float Widget::getValue(float x, float y)
{
    //获取网格高度
    //这里使用width - 1
    //是因为按像素插值的时候,将默认原始数据在网格顶点上,这样方便我们往网格中插值
    int blockW, blockH;
    blockW = image->width() / (::width - 1);
    blockH = image->height() / (::height -1);

    //获取网格的索引
    int indexw, indexh;
    indexh = y / blockH;
    indexw = x / blockW;

    //获取像素点再网格中的真实长度
    //这个数据用于计算插值的比例
    float bx, by;
    bx = x - blockW*indexw;
    by = y - blockH*indexh;

    //获取像素所在四个网格顶点上的值
    float tl, tr, bl, br;
    tl = array[indexh][indexw];
    tr = array[indexh][indexw + 1];
    bl = array[indexh + 1][indexw];
    br = array[indexh + 1][indexw + 1];

    //获取像素点在所在网格中所占横纵比
    float xscale, yscale;
    xscale = (bx / blockW);
    yscale = (by / blockH);

    //先横向插值,然后纵向插值
    float v1 = tl + (tr - tl) * xscale;
    float v2 = bl + (br - bl) * xscale;
    float v = v1 + (v2 - v1) * yscale;
    return v;
}
加上之前的代码,运行之后:
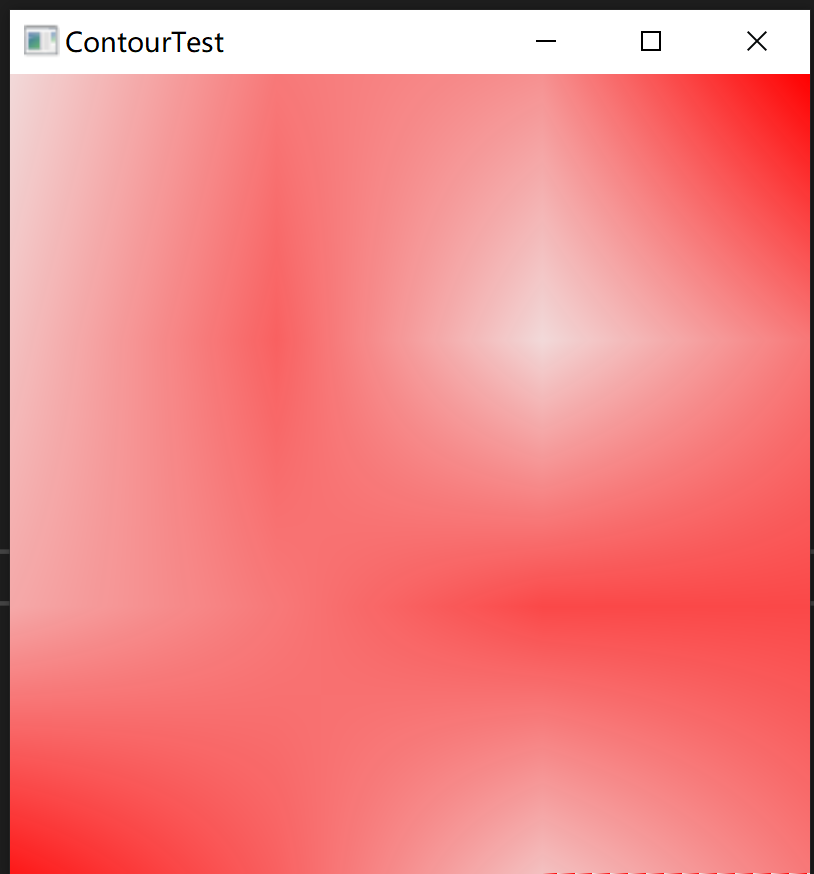
从这个结果,依然可以看出之前的矩阵数据对应的颜色变化趋势。
补充
需要注意的是,这里的插值公式是从之前的再两个数据中插入一个值的公式演变而来的,之前的公式是:
在A、B两个数中插入一个数据:(A+B)/2
这个公式实际上是做了化简的,它的原版应该是:A+(B-A)*1/2
这里可以将1/2看作是插入数据在A到B数据中的“位置”,比如我们现在要插入两个数据,那么我们只需要将“位置”替换为1/3和2/3就可以了。
明白了这一点之后得到这两个公式:P = n/N;
V = A+(B-A)P;
n = 插入的第几个数,N = 总共插入多少个数据。
然后插值的思路跟之前的是一样的,在矩阵数据构成的网格中,先进行对数据进行横向插值,然后再进行纵向插值。


文章评论
请问采用像素插值绘图,效果确实不错,但是如果对图像进行放大或者缩小,这个插值的过程是否会出现图像卡顿的现象?这个如何考虑呢??
@lin 如果数据量过大,建议把图片分段,然后多个线程一起渲染,我自己做项目的时候测试过1000*10000这个数量级的矩阵,放大缩小没有任何卡顿。